
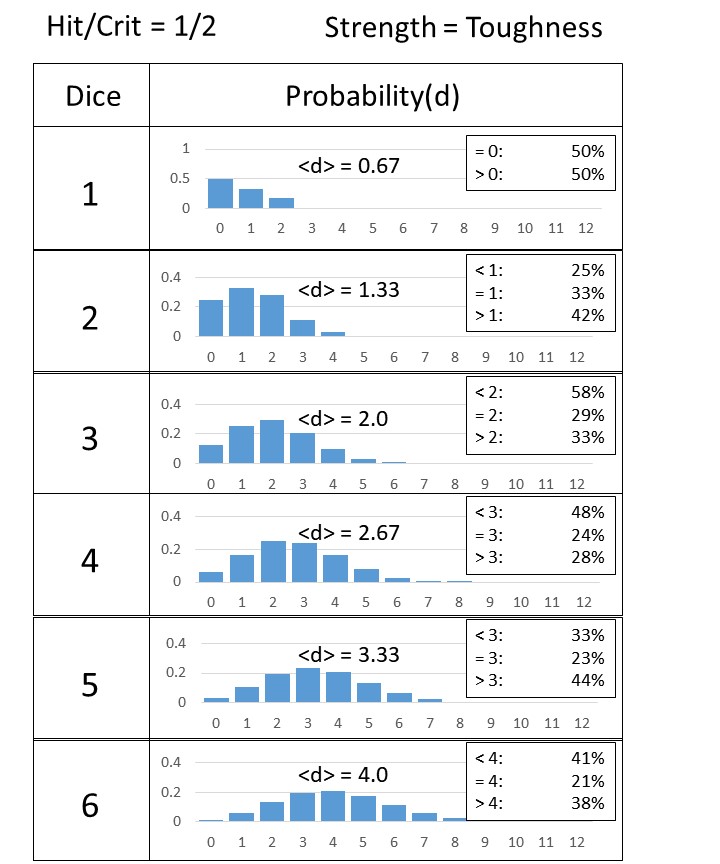
These charts show the probability of inflicting a particular number of wounds d as a function of the number of dice used, the strength of the unit, the toughness of the target, and the damage/critical damage of the weapon used.
<d> shows the average expected damage. Each inset shows the specific probability of inflicting d wounds on the target where d is less than average value, equal to the average value, or greater than the average value.
For example, the figure below shows the probabilities when the strength of the friendly unit is less than the toughness of the target unit. If 4 dice are used, then the average number of wounds is <d> = 2.0. There is a 40% change of inflicting less than 2 wounds, a 33% chance of inflicting exactly 2 wounds, and a 28% chance of inflicting more than 3 wounds.
If you find these graphs helpful, let me know and I can calculate the corresponding figures for any combination of regular/critical his strength (e.g. 1/3 or 2/5).


Related articles:
- Blackstone Fortress Probability Guide
- Blackstone Fortress Strategy Guide
- Homeschool Tips from Daddy Academy
- Science and Religion: Is It Either/Or or Both/And?
